For a long time I ran my servers blind. Two Proxmox nodes at home, a backup box, two machines at OVH and a mail server, and no single place to tell me any of them was in trouble.
The day a power cut took the house down, I realised I had no idea how long the batteries would last or which machines had survived. So I built myself a control room, and its name is argos.
One container to watch them all
argos is a small Debian container on my first Proxmox node, holding two pieces: an InfluxDB time series database that stores the numbers, and Grafana that draws them. Everything I care about reports into it.
Proxmox already knows how to push its own metrics, so both home nodes and the OVH one feed InfluxDB directly. The backup server sends its stats through its own metrics API. And on the bare metal I added Telegraf, which fills the gaps the native metrics miss: processor and graphics card temperature, and uptime. The two machines living at OVH reach home through a locked down SSH tunnel that can only forward to the database and nothing else.
Knowing the moment the power goes
The piece I had been missing the most was the UPS. There is an MGE Eaton unit plugged by USB into the backup server and managed by NUT. Telegraf reads it and ships the numbers that matter: battery charge, load, estimated runtime, and the input and output voltage.
Now, the instant the mains drops, the backup server shouts on Telegram through the same bot my voice assistant Maria already uses, and the dashboard shows me exactly how many minutes of battery I have left.
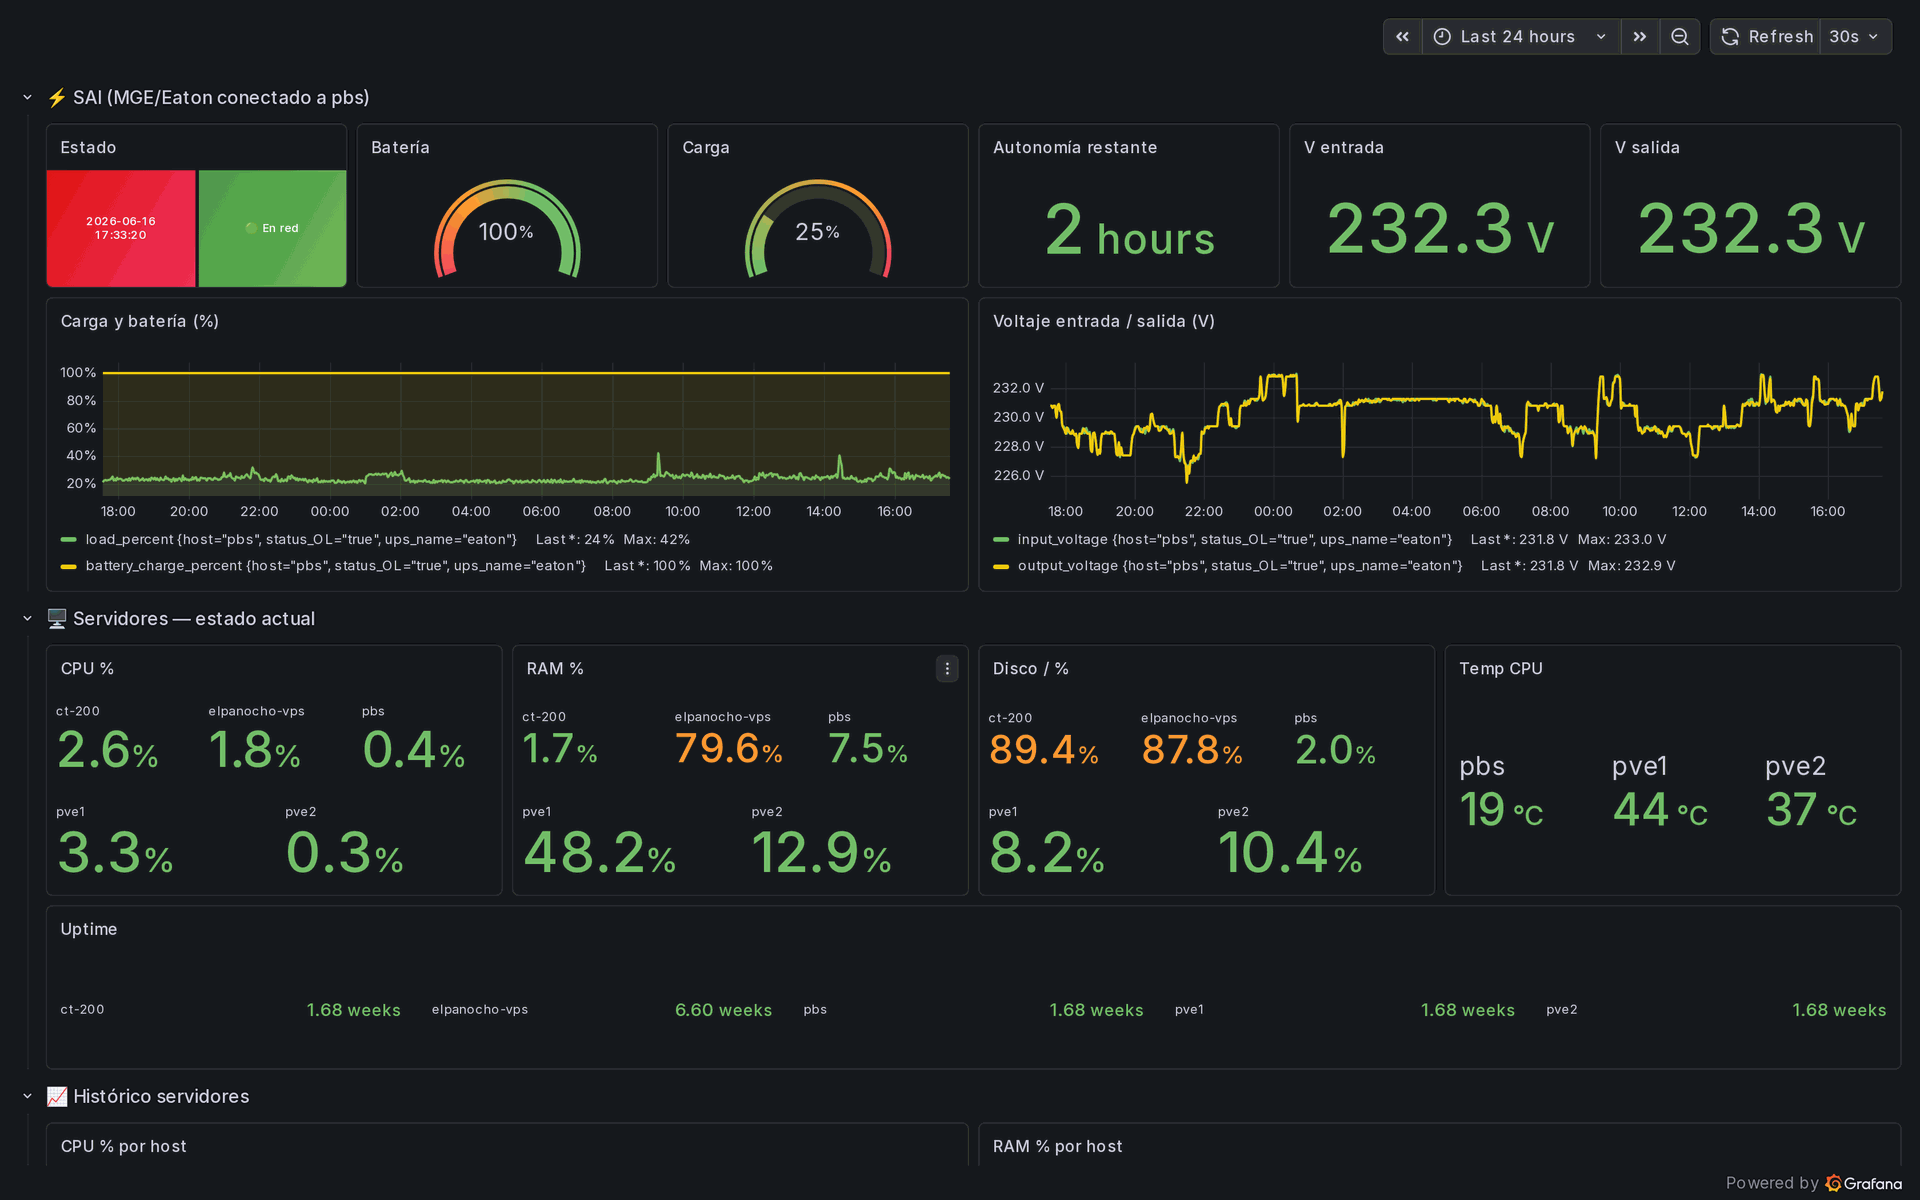
One screen, the whole estate
The result is a single dashboard called Infra LTC, the UPS and the servers. The top row is the UPS: status, battery at one hundred percent, load around a quarter, two hours of runtime and a steady two hundred and thirty volts in and out. Below it, every server with its processor, memory, disk, temperature and uptime, coloured green, amber or red against sensible thresholds.
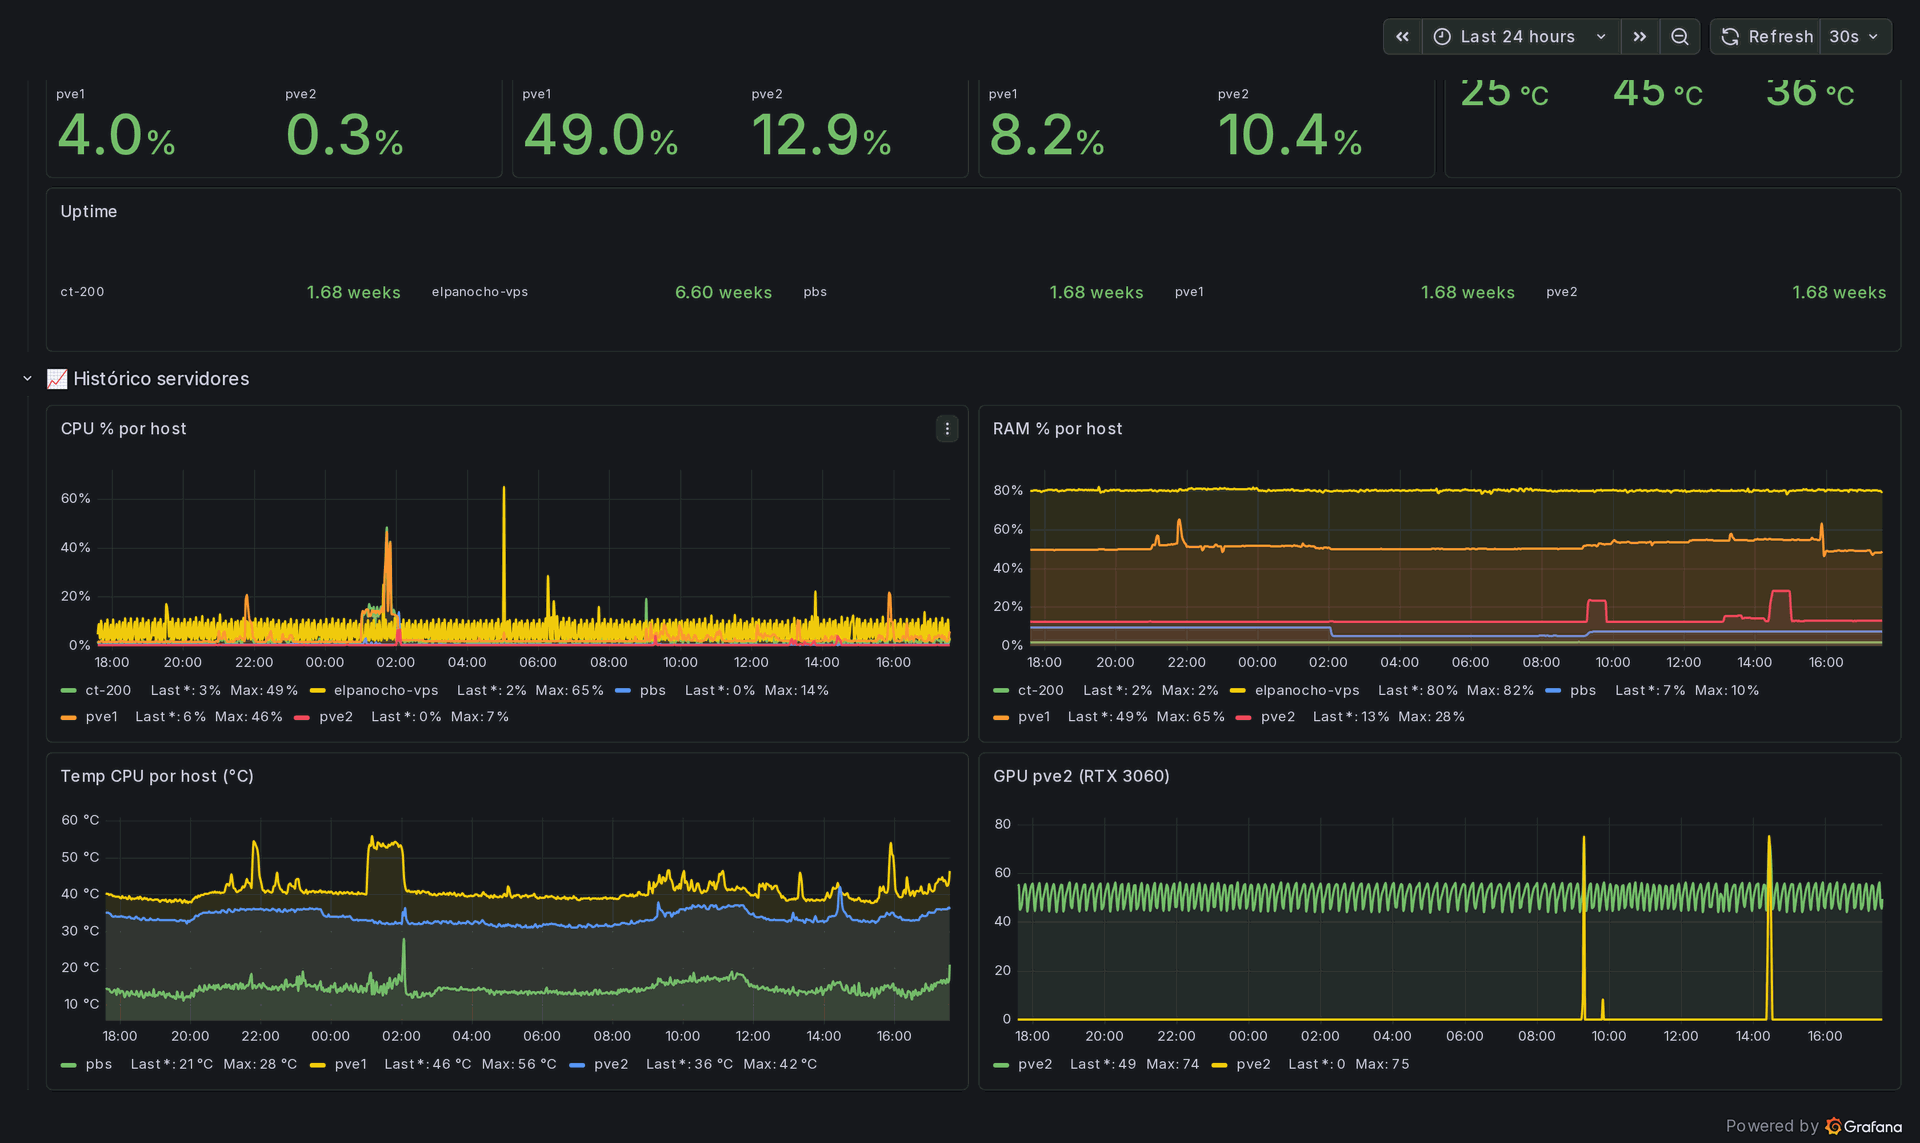
Underneath sits a full day of history for each host, plus the temperature of the graphics card I use for my local AI experiments. Five alert rules watch the boring but dangerous things, a disk above eighty five percent or memory above ninety, and ping my phone before they ever become an outage.
Written down, not improvised
None of this lives only in my head. The whole setup, the telemetry, the alerts and the dashboard builder, sits in a git repository with the secrets kept out, so I can rebuild the control room from scratch on a new machine in minutes.
The point was never the pretty graphs. It was turning a pile of servers that used to fail silently into an estate that tells me, out loud, the moment something is wrong.